MetaTrader 4 Strategy Tester is designed for testing and optimizing indicators and trading robots before using them in real forex trading. Other testers can be integrated in it, adding more functions. The testing statistics is uploaded into trading journals and editors for the analysis. From this article, you will learn about advantages and flaws of the MT4 Strategy Tester, how to analyze backtesting results and what problems in Expert Advisor testing and optimizing can be.
MT4 Strategy Tester overview: testing, optimization of indicators and trading systems
Analysis of the efficiency of trading systems, manual strategies and indicators is an obligatory condition that must be fulfilled before using them in real trading with real money (and on a demo account as well). Forex strategy testers may be separate programs or, they may be applications to particular platforms. They can also be divided into those that are designed to test only manual trading strategies (Forex Simulator, FX Blue Trading Simulator) and those that can be used to test trading robots as well.
The article covers the following subjects:
- MT4 Strategy Tester overview: testing, optimization of indicators and trading systems
- MT4 tester – a universal simulator for Expert Advisors and indicators
- 1. Testing of indicators and manual trading systems in MT4 Tester
- 2. Testing automated trading systems with MetaTrader 4 Strategy Tester
- 3. Analysis of the statistics and the problems of analyzing backtesting results
- 4. Expert optimization on historical data
- 5. Flaws of optimized Expert Advisors in real trading
- 6. Where to test: МТ4 or МТ5?
- Conclusion
I tried to make the overview as detailed as possible, to cover as much information as possible but in simple terms. If you find any errors or inaccuracies, please, let me know in the comments!
MT4 tester – a universal simulator for Expert Advisors and indicators
According to the testing method, testers are divided into two types:
- Cyclic testers. They consistently analyze one candle after another. Receiving a new value of the last candle, they make some calculations based on the formula, taking into account the data of the previous candles. If the factors specified in the code / parameters coincide, they open and close orders. According to the testing results, trading statistics made up. The flaw of these testers: they don’t take into consideration the real spread, slippage, that is why the result of testing is far from what will be on a real account.
- Event-driven backtesters. They are as close to real market as possible. The tester’s architecture suggests that, when a particular even occurs, it will generate new situational random events that may affect the final outcome. The drawback of these testers is a complicated code and, as a consequence, a greater likelihood of errors. One needs to know the programming language to design a trading system for such a tester.
MT4 tester refers to the first type
MetaTrader 4 is constantly upgraded and so, its backtesting functions are also upgraded. For example, in the previous versions (available a few years ago), it was not possible to test indicators. Traders studied the basics of computer programming, took an “empty” expert (a template with integrated risk management parameters, lot calculation, etc.) and added an indicator code to it, adjusting it a little. Now, the MT4 Tester is a multifunctional program for basic testing that allows to test indicators and trading robots in any time period with the subsequent uploading the statement into editors.
1. Testing of indicators and manual trading systems in MT4 Tester
The Strategy Tester in the trading platform allows you to test not only Expert Advisors, but also indicators. The function of testing indicators in the MT4 tester means that the trader can now monitor the indicator performance on the historical period in “real time”. That is, you set the beginning of the period in the chart and start testing in visual mode, so that you can see the indicator painting the lines. This lets you:
- Detach yourself from the right part of the indicator. In the visualization mode, the right side of the chart hasn’t been painted yet and the trader doesn’t know where the price will go and takes a decision based on the information currently present, without “peeping into the future”.
- See whether the indicator repaints
How MT4 tester works on the historical data
- Testing is possible only with one trading instrument, there is no portfolio testing
- Size and multiplicity of lots, swaps and commissions are taken from the parameters of the current account.
- Modeling is carried out as close as possible to market conditions, but there can be significant differences in cross rates due to the lack of accurate rates at the time of conversion at each timeframe.
- In the test period, trades are entered in the Instant Execution mode.
- Testing is not performed on non-standard timeframes, even if you add them using a script.
Any testing, regardless of whether it is MT4 Tester or another simulator, starts with the downloading the historical data. In MT4, this is done as follows:
- Click on Tools/History Center
- Tick the needed currency pair and choose M1 charts (their provide the most accurate historical data)
- Download the data
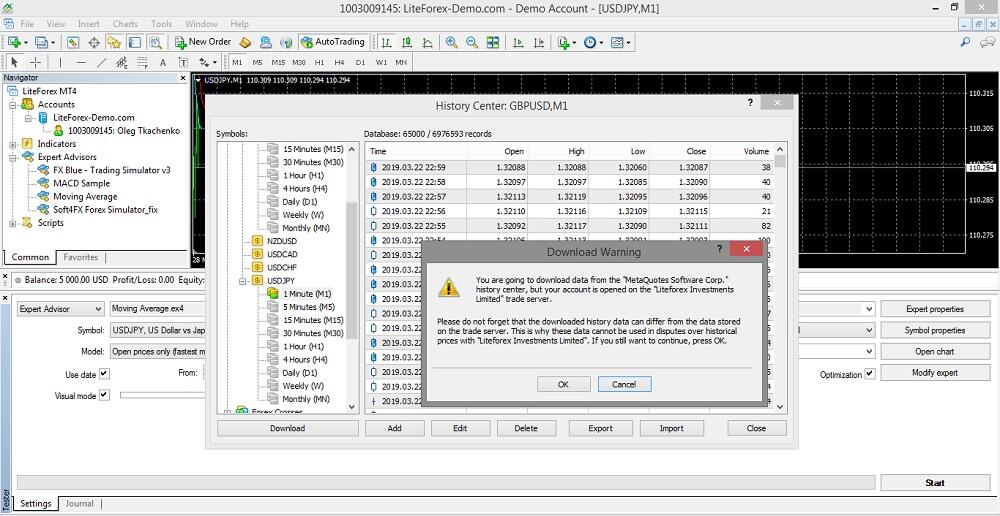
The data are downloaded from the MetaQuotes server. The quotes of MT4 developer may differ from the those of the broker. Due to the difference in the data, there are differences in the testing statistics, and the quality of the data is the first thing you should pay attention to before you start testing.
You run the tester, there is a corresponding icon in the toolbar. Or, you open the View/Strategy Tester menu. Open the currency pair, for which you have downloaded the historical data, in the chart and attach the indicator. In the tester window that has opened in the bottom part of the platform, click on the Indicator tab and choose the one you are going to test. In the given example, it is Alligator.
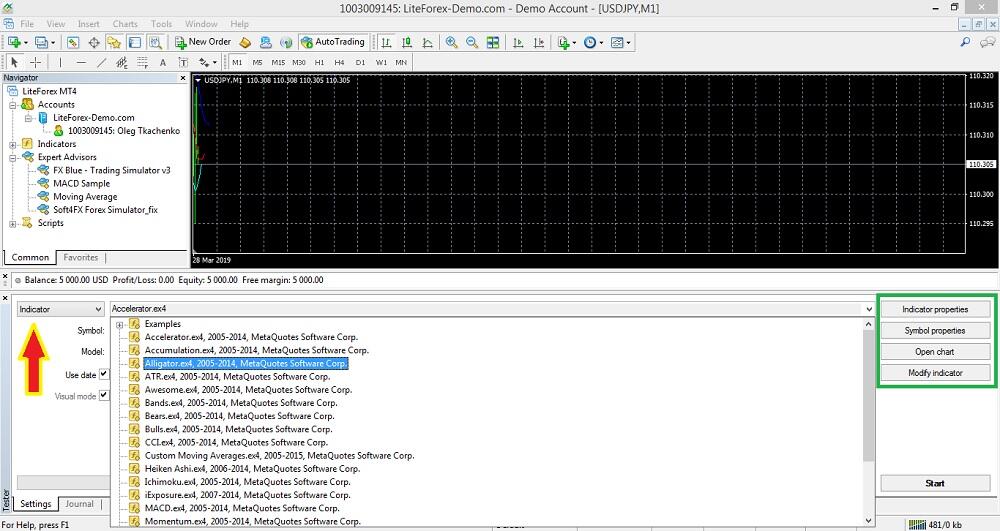
On the right, there is the Indicator properties menu (highlighted with the green box).
1. Indicator properties. Here, you can custom the indicator settings that will be run for backtesting. Note that this is only for the indicator to be tested.
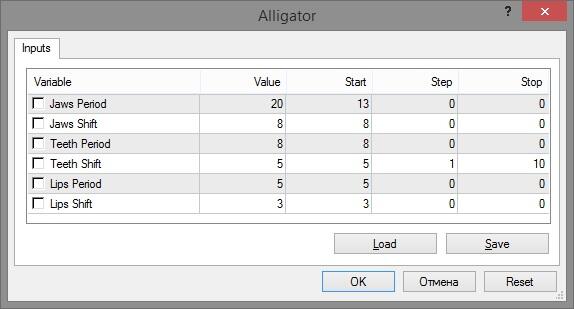
This is Alligator settings window before testing
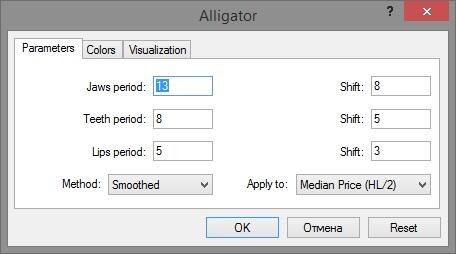
This is Alligator settings window in the standard trading chart. As you see, they are different. Is this a drawback? I suggest we discuss it in the comments.
2. Symbol properties. This an information window, you can’t modify anything there. There is specified the initial deposit, stop loss levels, spread and so on.
3. Open chart. This button doesn’t work. Nothing changes when you click on it, and this is an obvious flaw of MT4. This problem was described on the forums before, but nothing has been fixed.
4. Modify indicator. This section provides an opportunity to modify the essence of the indicator being tested by means of MetaEditor, but you can do it only if you know the code.
Now, there is a brief overview of the tester main menu.

In the Symbol section, select the trading instrument, which you use to test the indicator. In the studied example, it is the USD/JPY pair, whose historical data were downloaded. In the section Use date, specify the time period when the tester will be run. The Optimization window is active only for Expert Advisors. In the Visualization section, there is a slider, which adjusts the speed of the chart movement (tester run). There is a bug in the run: when you move the speed from 31 to the maximum 32, the run of the chart sharply increases several times.
In the right part of the dialog window, you can set the timeframe, choose floating of fixed spread. It is done for convenience. For example, the spread is usually too high at night, and, if the strategy uses an indicator at night, then it makes sense to set the current spread.
- Advice. One of the options for stress testing involves setting obviously worse parameters than real market conditions. The stability of the trading system to force majeure is the key to success under normal conditions, because stress testing involves analyzing the performance of the trading system (this is especially important for robots) at different costs (spread, swap, etc.). MT4 does not allow setting any spread and, so, you can use the Spread Changer script. If you do not find an updated (free) version on the Internet, write in the comments your email address and I’ll send you the script as soon as possible.
And now, the most interesting box, Model of testing. Here, you can choose between several models.
- Every tick. It is the most precise method but it takes the longest time. IT implies generation of ticks within a candlestick. Candles are formed in the shortest timeframe M1. The method works like this: a bar is formed according to the OHLCV pattern (Open – High – Low – Close, Volume). Inside the bar itself, the price may swing up or down several times, which affects the accuracy of calculations but complicates the tester’s mission. It can be roughly outlined like this:
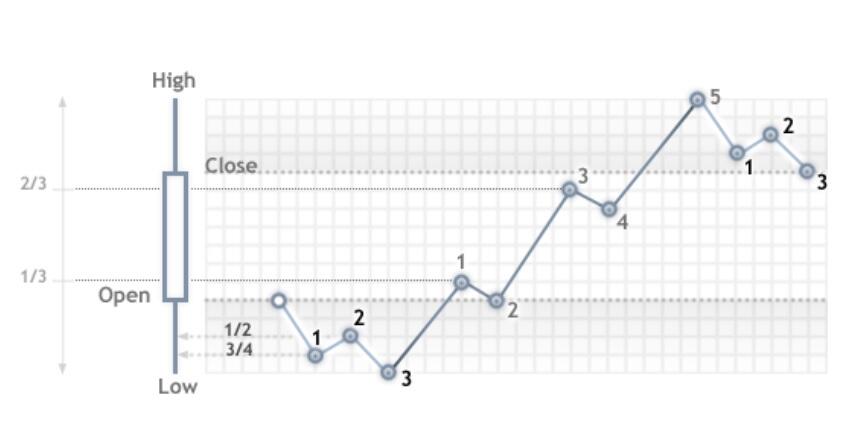
Reference points are marked with numbers (there is no point in going into details of the calculation). The check “by every tick” gets you to monitor the tester in case of each price change inside the bar. It is the most precise, but also a rather time consuming testing method.
- Control points. It is based on the data from the nearest less timeframe, therefore, testing is faster but less precise. For example, for the timeframe of M5, the data from the M1 timeframe are analyzed. It is used to have a general overview of the indicator performance.
- Open prices only. It is the fastest method to analyze the bar just completed. An Expert Advisor analyzes the market and enters a trade at the beginning of a new candle (open price). The first step is modelling of a bar (Open = High = Low = Close, Volume = 1). The next one is presentation of a fully complete bar. In the chart, the bars are drawn one after another, without intrabar price swings, the indicator formula considers only a single price value, the bar opening price. Trailing doesn’t move inside the bar.
If a take profit and a stop loss are both inside the candlestick, the tester will first run the stop, though it could have been vice versa. That is why, this model is used to test trading robots that don’t employ a stop loss or a take profit orders.
No to go too far into details of the chart drawing methods, I recommend you to observe the following rule: run the testing process with the same parameters using all the three bar modelling methods. If the graph and the reports are almost the same, the Expert Advisor is optimized. If there is a big difference, a rough check could be performed according to the fast method, and then optimize the strategy, based on every tick method. This is true for testing Expert Advisors as well.
Once all parameters have been set, you can initiate the backtesting process by pressing the Start button and awaiting the results. I should note that each time you click on the button, there opens a new graph and testing process starts from the very beginning. To pause the tester and enter a trade you need to click around the speed scrollbar. You can’t go back and enter a trade retroactively. The Stop button fully stops the testing process and you can run it only from the beginning.
If the testing process doesn’t start for some reasons (problem with historical data and so on), restart the MT4.
Advantages of the MT4:
- It is universal. The tester can test any indicators, as well as full trading systems (manual strategies, expert advisors). Any unique indicator, whose code is compatible with MT4, can be attached to the chart and tested.
- You can use the program together with other simulators, MT4 tester can be run both alone and together with other similar programs. For example, when you install FX Blue Trading Simulator, navigation parameters are set in the window of the MT4 tester. Differently put, the FX Blue is integrated into the platform basic simulator.
MT4 tester drawbacks:
- Not all functions for testing indicators work correctly. There are problems with the indicators import (adding them) during a pause, the indicators do not receive updated information from other timeframes, that is why the result is not correct.
- You can’t change the time span during the testing process
- You can’t enter trades. During a pause, you can add other indicator, change the visualization “bars/candlesticks”, remove the grid, change the color scheme, but you can’t enter trades. Therefore, you can’t evaluate the profitability of your strategy and other statistics, as no trades are entered, there can be no trading statistics.
The latter drawback ruins all the benefits of testing indicators. A trader can only see the chart being drawn and the indicator working, but cannot put orders.
There are three ways to solve it:
- Install an addition tester of manual strategies that should supplement the MT4 Tester.
- Develop an Expert Advisor based on the indicator, you need to add the entry/exit conditions to the indicator code.
- Visually assess the indicator performance. When there is a good entry moment, pause the testing process and put an arrow or any other symbol (Insert/Symbols). You can only visually assess whether the decision was successful, as trades are not entered, so, there can’t be any statistics.

Note! There are no troubles with testing integrated indicators, there are sometimes problems with testing added indicators. The function of indicator testing was added to MT4 a few years ago. If the indicator had been designed before this function was added, the tester may fail to run it.
2. Testing automated trading systems with MetaTrader 4 Strategy Tester
An Expert Advisor is tested almost in the same way as an indicator. MT4 has a built-in editor, MetaEditor, where you can write the code of the trading robot that will be accurately synchronized with the platform. Testing here also starts with importing the historical data.
They can be:
- The data from MetaQuotes. I described how to download them in the previous part. Their quality is often criticized, but they will do for training.
- The broker’s quotes that should be on the platform, downloaded from its website.
Open the Tools/Setting menu, click on the Graph menu, copy the value from the field of “Max bars in history” and past it in the field “Max bars in window” (by default, it is 65,000).
Open the tester and in the box, where we chose Indicator in the previous example, you now select Expert Advisor. All the rest parameters are similar to testing an indicator, except for the Expert properties.

There are three tabs in the Properties window:
- Testing. Here, you set testing parameters. These are volume and currency of initial deposit, types of positions (for example, only long positions or only short ones).
- Inputs. The list of all inputs is given here as a table. Inputs are variables that influence the expert work and can be changed directly from the client terminal. Data to be written in the fields of “Start”, “Step” and “Stop” do not influence the expert testing, and are only used for its optimization. You don’t put ticks in the variables window.
- Optimization. You will need this tab after you have tested the Expert Advisor and want to optimize it. I will describe it in detail further, in a special part.
In the Inputs, there is a Download button that facilitates setting the parameters. When you test one robot on a single currency pair and you have 4-5 basic parameters, they can be set manually. But when it is about a robot with 10 settings and more (especially about multi-currency Expert Advisors) and about testing on the dozens of assets, one can easily be confused. So, robots are usually supplemented with files that have the.set extension where the basic parameters are already set for each currency pair. You just need to upload these parameters.
The Optimization option is disabled when you run the EA tester for the first time.
Press on Start button and see the chart. I should note that when you test an indicator, trades are not entered on the historical data, in this case the robot puts orders itself. If you are interested in the EA work principle, I can recommend monitoring the chart, it doesn’t take much time. But you can also skip visualization, set the needed data in the tab “Skip to” next to the speed scrollbar. Until this date, testing will be passed without visualization (without chart), but the trades will be included in the report.
3. Analysis of the statistics and the problems of analyzing backtesting results
At the bottom of the platform workspace (and the tester as well), there is the menu, where you can see the statistics; I marked it with the red box in the screenshot below. I also want to stress that this screen presents the testing process for an Expert Advisor, based on Moving Averages. You can see the trades being entered, exited, quotes and the reasons for exiting. The box above the tester, where you can see the balance amount, is the box for current transactions that you can execute together with testing in the next tab. The Balance above the tester doesn’t relate to the testing process!
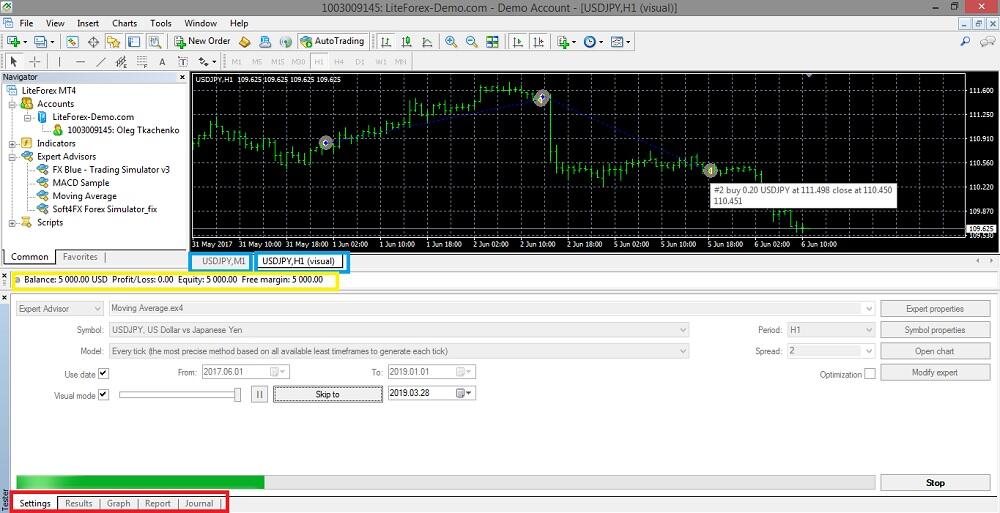
I suggest you start analyzing with the Graph tab. If the equity curve (the balance curve) is clearly descending, with sharp jumps and deep drawdowns, go back to the Expert properties and configure the parameters. If the Expert Advisor has entered no trades at all, there is some error. Look for the error code in the Expert journal, the description is on the mql4.com website in the “Documentation” section (Reference).
The Results tab presents the testing results. It shows the information about all trade operations performed, for example, the time, the type, the open/close price (including close at a stop loss or a take profit), the profit and the balance.

I will describe the Report tab in more detail

1. Bars in test. This is the amount of the modeled history data in bars;
2. Ticks modeled. It shows the amount of the modeled ticks. Each sequence entry is a bar state at a particular point in time. The point is that a bar is a complete pattern of the price OHLCV (Open – High – Low – Close, Volume). The number of bar states may vary depending on the timeframe, the quality of quotes. In theory, the more ticks are modeled, the more precise is testing and the longer time it takes. In practice, there are situations when a detailed run is a waste of time, since the results will not differ from a faster testing mode.
3. Modeling quality. It is the quality of ticks modeled during testing in per cents. In MT4, the value is not above 90%, that is, 90% is the best result. If the values is less, you need to check the quotes quality, and you shouldn’t use the Expert in real trading.

- HistoryTotal – the total amount of bars in history;
- StartBar – the number of bar with which the testing was started.
- StartGen – the number of bar with which the modeling on the nearest timeframe started;
- StartGenM1 – the number of bar with which the modeling on minutes started;
- 0.25, 0.5 and 0.9 are weighting factors
If you select Open prices only as the method of bars modeling (fastest method), the parameter value will be n/a”, which means modeling has not been performed at all, it will be written in the “Modelling quality” field;
On the forums, you can find the opinion that the accuracy of 90% is obviously the failure in real trading. To improve the accuracy up to 97%-99%, you can use the free Tickstory Lite program, whose overview is the topic for another article. If you want to learn how to improve the quality of modeling with this software, write about it in the comments.
4. Mismatched chart errors. Errors appearing when ticks are modeled in different timeframes. The most frequent reason is the difference between the data from the history center and the quotes provided by the broker.
Modeling quality is schematically displayed as a band in the next line of the report. This band can be of one of four colors:
- Light-green. Modeling was performed in the M1 timeframe.
- Dark-green. Modeling was performed in the longer timeframes (from M5 to H4)
- Red. modeling was not performed within this subrange since no data of a smaller period were available. At that, only data from the period selected in the tester settings were used;
- Grey. This part of the data available was not tested at all.
At that, the brighter the color is, the better in quality the modeling was, as there were more data of the shorter timeframes available. If any part of the band is grey (no data available), reload all the historical data.
- In the main menu, open File/Open data catalog
- Open History folder and select the folder with the name of your trading server
- Delete all the data for the currency pair being tested. Download the data once again.
Other parameters are trading performance; I described how to analyze it in this article. I will only add some peculiarities that haven’t been mentioned.
- Total trades – at least 150 trades for any timeframe
- Expected payoff . This statistically calculated index represents the average profit/loss factor of a trade. It can also be considered for representing the expected profit/loss factor of the next trade; It is measured in the deposit currency, but you can switch it to points manually if you want. If the expected payoff is less than 10 units, it may suggest that the robot exits winning trades too quickly (that is, it reduces potential profit).
- Absolute drawdown. It is the difference between the initial deposit and its lowest value during the testing period. Maximal drawdown (%) is the maximal loss of the local maximum in the deposit currency and in percents of the deposit;
You can save the report by right-clicking on the testing result
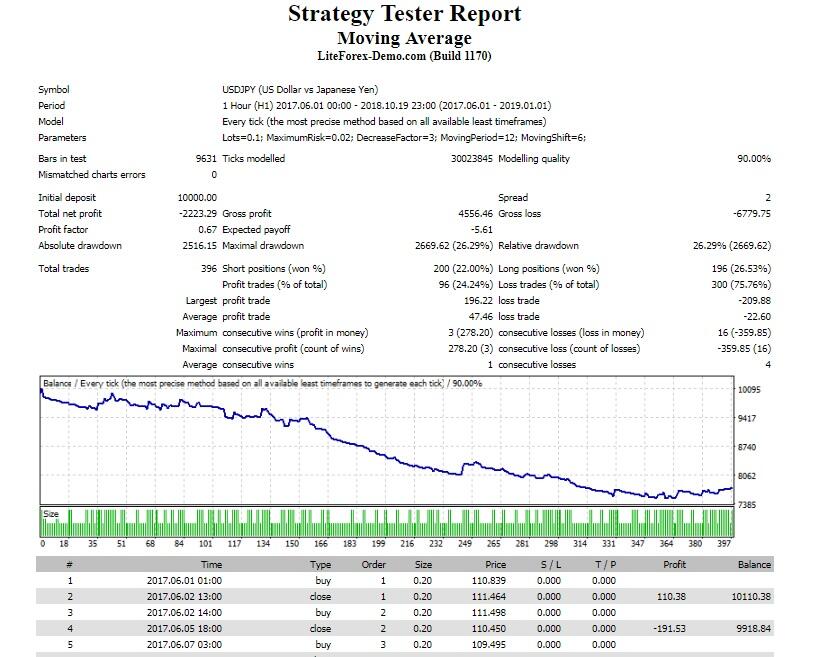
This backtesting report can be copied to the clipboard or saved in the hard disk as an HTML file. To do so, one has to execute the “Copy” context menu command or that of “Save as Report”, respectively
Backtesting can be saved not only in HTM format, but also in Excel or other programs that can automatically group data using a given algorithm and output statistics in a convenient form. For example, in the form of diagrams and graphs. This is convenient when you compare multiple trading systems or several combinations of parameters for one system.
Also, the fraudsters can import the report data into editors.
In addition, backtesting results are used for personal purposes. For example to illustrate the efficiency of a trading strategy when one wants to sell an Expert Advisor or to attract funds for trust management. Features of a fake backtesting report:
- HTML type. When you save the backtest, MT4 offers HTM type, but the HTML is a more common extension, so those, who fake backtesting results select it. Although you can write the HTML type manually, there is no point in doing it. So, the HTML extension is the first sign that the backtesting report is fake.
- Spaces or missing lines. MT4 presents the report as a straight text. If there are spaces, it means that the backtesting report has been corrected manually, and it was imported to an editor before.
- Extra characters (dots, commas). To check, you can generate any report in MT4 and compare your report with someone else’s backtesting report.
- No commissions, irrelevant quotes, errors in spread. If there is no commission, it is a clear sign that testing was performed on a demo account. You can import the data into Excel and check with a couple of formulas whether the commissions, open/close prices, profits and balance correspond to each other. If the losing trades have been deleted, or numbers have been changed, Excel will show a discrepancy.
- Tickets are the same, the order of tickets doesn’t correspond to the time of entering the trades.
Advice. If anyone offers you to invest in a trading system and shows you a backtesting report as a proof, ask the investor password.
4. Expert optimization on historical data
Expert optimization in the MT4 Tester represents consecutive passes of the same expert with different inputs on the same data. At that, such parameters can be taken that make the expert efficiency maximal. Optimization is needed in two cases
- If you have just developed an Expert Advisor and want to optimize it for other time periods or trading instruments.
- The market situation has changed. The market is volatile, price trends are changeable, so, any trading systems must be configured form time to time. The parameters are checked automatically in the tester.
Before you start optimization, you put a tick in the corresponding box in the tester’s main menu. You may switch off Visual mode. Optimization is performed on the Every tick model (run the tester on all the three models and compare how precise the results are).
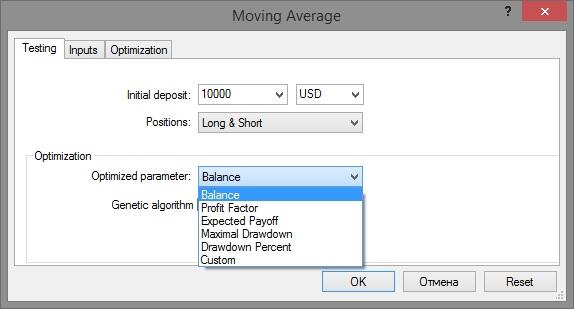
4.1. Testing. Enter the tab “Expert properties/ Testing”
In the “Optimization ‘section, you select the main parameter, based on which each run of the tester through the historical period will be evaluated. An optimized parameter is a certain factor, whose value defines the quality of a tested set of parameters.
- Balance. The tester selects the best results based on the balance value. The set of the best parameters will correspond to the version where the key factor is the highest value of the balance;
- Profit Factor. The key parameter is the highest value of the profit factor, i.e. the ratio of winning and losing trades. If the value is 1 or less for all tests, the Expert can’t be used in real trading.
- Expected Payoff. The key parameter of the robot here is the expected payoff that should not be less than spread.
- Maximal Drawdown. The key point is the lowest value of the maximal drawdown that is the indicator of the real risk. In theory, it mustn’t exceed the amount of the initial deposit.
- Drawdown Percent. The benchmark is the lowest value of the relative drawdown (in percentage terms).
- Custom. The optimization criterion here is the value of the OnTester() function in the Expert Advisor. This parameter allows using any custom value for the optimization of the Expert Advisor. Based on trader’ feedback, this function doesn’t work.
If you switch off Genetic algorithm (remove the tick), the tester will pass all existing combinations of parameters through the criteria set. Considering that it may take much time, I don’t recommend turning the function off.
4.2. Inputs. All inputs are listed here as a table. Inputs are variables that influence the expert operation and can be changed directly from the client terminal. There are checkboxes to the left of variable names that include the parameter into optimization process.
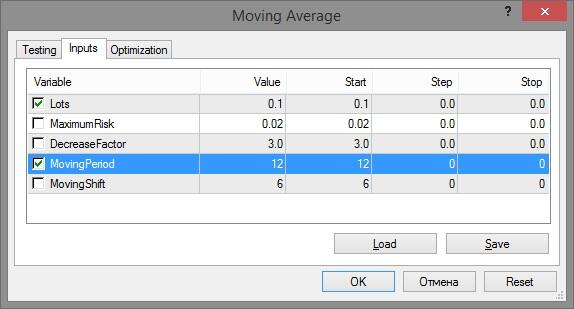
If a variable is not checked in this checkbox, it will not be involved into optimization. Each variable has for values.
- Value – the current value of the parameter
- Start – initial value
- Step – change interval
- Stop – final value.
For example, you want to find out an optimal stop loss level. You understand that in day trading, it make no sense to set stop at 50 points, but, at the same time, it is not correct to set it at a level less than 10 points. So, you enter these limits in the corresponding fields, so that the tester won’t consider parameters that are obviously not correct for the strategy, that is, it will save the time.
You can set the minimal step, but there is no point in it. It is not that important if the stop is 11 or 12 points, but the testing process will take more time.
In my example, the expert advisor has only 5 parameters. There are robots that have much more settings. The more settings are specified, the more combinations should be checked by the tester. At some point, the amount of combinations becomes critical and the tester stops optimization at all, that is reported as an error in the journal.
4.3. Optimization. This tab allows to manage limitations during optimization. If any of conditions is met during a separate pass, this pass of the expert will be interrupted. Optimization will continue with the next pass.
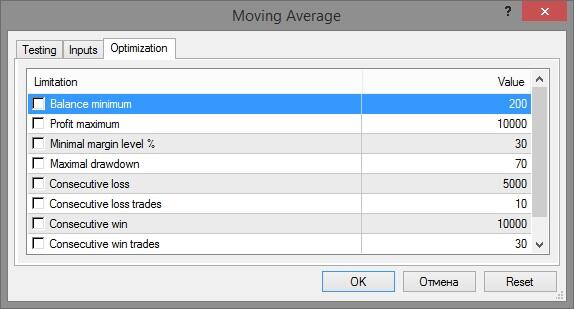
For example, you can specify the Balance minimum (that is the level, below which it makes no sense to test the adviser, since it is not operational), after which the optimization stops. Similarly with other criteria.
Optimization methods:
- Testing is performed on 2 equal sections. The Expert Advisor is passed through both, up to 10 optimal options of parameters on each of the sections are saved. It is based on the version of the pass, where the parameters are approximately the same in both sections.
- Forward testing. The period is divided into three parts: the first two ones are the period of testing and optimization, the last one is the period of forward testing, where the best results are selected.
- Backtesting and forward testing. The period is divided into three parts. The earliest period is for the initial testing, the middle one is for optimization. Several sets of parameters that have been selected are passed through the last, forward period. The best variant is tested on the first period (backtesting) and then, on the entire historical period. In all periods, the results (statistics and the type of deposit curve) should be relatively the same.
The best set of parameters is run on the demo account. 30-50 trades on average are enough to see how the trading statistics will match to the optimization results.
5. Flaws of optimized Expert Advisors in real trading
The MT4 tester is not perfect and the most frequent traders’ claims about it concern Expert testing. However, this is partly the fault of the traders themselves. Testing doesn’t provide a 100% guarantee that real trading will perform the same results. It doesn’t matter how complex and optimized a trading system is, the testing results will always contain some inaccuracies that traders somehow forget about this.
Mistakes of traders, fully trusting the tester and Expert Advisors.
1. Testing and optimization includes only In-Sample data. It is testing on particular basic data of a fixed period. So, traders just adjust the testing results to the needed deposit curve and the results in real trading do not match to the testing results. It is a common error of beginner traders, who don’t want to learn the concepts of the expected payoff and statistics, employed in the Out-of-Sample (out of sample parameters).
In a simplified form, the optimization procedure looks like this:
- A historical period of at least 5 years is taken for testing. The span is divided into 3 parts.
- The interval that includes the first 2/3 of the period is the In-sample data, which will be used to adjust the parameters of the Expert Adviser.
- Optimized system is tested on the last 1/3 of the period. If the results have a low correlation (very different), the system won’t work in the real market. This is the so-called forward testing, conducted manually.
For automated forward testing that was not provided in MT4, relatively recently, the Walk Forward Optimization (WFO) library and the Walk Forward Reporter script became available in the Market. These are step-by-step forward-optimization tools that repeat the passes many times with the window shifting into the future.
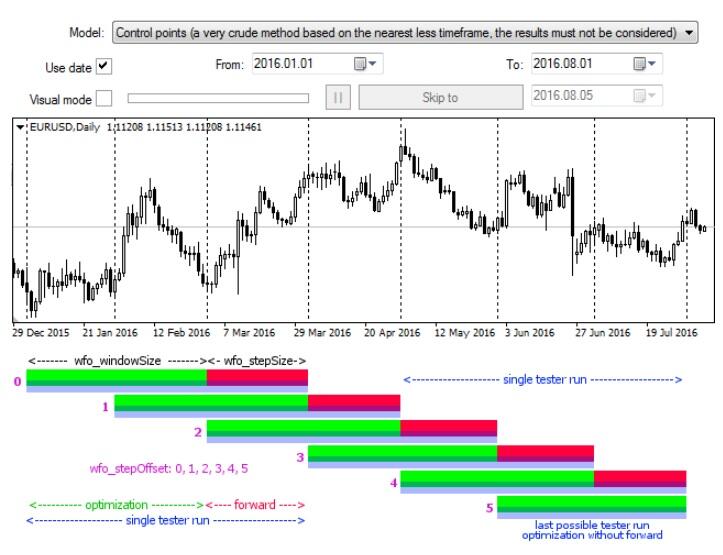
Methods of testing and optimization are described in detail on the mql4.com forum. If you want to know how to install the library, to write the code and you’d like to get an instruction on using these tools, write in the comments and I’ll send you a link.
There are also individual variants of testing on the In-sample and Out-of-sample data: the Expert optimization on the least successful period (the losing one) with a subsequent run on the entire period. Or you can optimize the robot on the period of 1 year and then, you pass it through the periods of “1 year + 3 months”, “1 year +6 months” and compare the results after that.
2. Change in the market cycle. The longer is the period that you try to cover when testing, the less likely you are to get a losing system, even if you can find the optimal parameters. The market is cyclical and the expert adviser will perform different results during different cycles. Therefore, a trader has two options:
- Select the universal parameters of the expert adviser for a long period, but keep in mind that the result on a real account may be worse.
- Divide the interval into sections and determine during which (flat, fundamental surge, the end or the beginning of the year, European or Asian sessions, etc.) the robot works best. Custom the parameters and test the robot in the particular periods for which it is designed.
3. Commission expenditures. You need to set them in the tester manually.
- Spread. Traders often set a spread that can be 2-4 times less than the real market one. If the broker’s spread for a particular currency pair is, for example, 0.7 points, it doesn’t mean that it is really so. In the offer agreement and trading terms (which are seldom read till the end), there can be additional commissions for some account types.
- Swap. It considerably reduces a potential profit.
- Slippage. It depends on the broker and the market situation. It is not taken into account in testing, so the result on a real account will differ.
4. Market liquidity and market-makers. In the testing mode, one may enter scalping trades for hundreds of lots and receive excellent results. In the real market, such a volume of transactions will inevitably shift the price, especially at relatively calm time at night. Tester doesn’t consider such price shifts by the volume. It also doesn’t consider artificial pressure on the market created by large investors when they want to take profit.
5. Quality of the historical data. The quality of a broker’s quotes is not always high. In short-term timeframes, there can be missing sections. What source of quotes will you recommend? I’d like to learn the opinions of Alpha Masterclass blog readers!
6. Low resistance to changes in parameters. Another common mistake of traders when optimizing. Suppose that, after a series of parameter tests, you managed to achieve the best results over a long historical period. Can you use such a system in real trading? No. If any change in parameters results in far worse results on the test data (for example, a change in the indicator parameter from 8 to 9), the system won’t work.
7. Full trust in the Expert. The developers of expert advisors claim that with automated trading, you can forget about psychology, since the robot operates according to a predetermined algorithm, brushed on historical data. As I wrote above, there are no ideal robots. Therefore, the success of a trader in algorithmic trading is to switch to a manual trading in the right time and constantly adjust it to the market conditions.
Some advice on optimization.
- The optimization period for the daily timeframe is at least three years. Therefore, the entire period for adjusting the trading system is four or five years and more.
- You shouldn’t optimize many parameters at a time. This will artificially adjust the result to the history and the system will fail in real trading.
- To reduce the optimization time, increase the Step in the settings. The period with the best results will still be visible, but the load on the tester will decrease. The best part can then be passed through the tester again in more detail.
- Do not try to optimize the system as much as possible, spending hours and days on it. Anyway, after a while it will have to be optimized again. If the optimization fails, upgrade the expert advisor’s algorithm
Which is simpler, to create your own trading robot and optimize it or to buy a working trading system, based on the analysis of its backtesting result? The question is rhetorical. Creating your own system is a dull job that takes days and weeks and does not always yield a positive result.
It is not difficult to work with the MT4 tester, what is difficult is to optimize a system and select the right parameters. Buying complete trading systems is not a panacea either. Backtesting results can be faked, no one guarantees that the system will be working. For example, a few years ago, in the Market (section mql4) there were popular forex predictor indicators. Their code allowed traders to be guided by the quotes of future periods, thereby presenting the desired as valid. In the real market, they hardly worked.
6. Where to test: МТ4 or МТ5?
Although MT5 is not so popular among traders, the tester on this platform has much more positive comments than MT4 tester. Mostly because the results are more precise. I offer the readers to find out if it is so or not. I will only stress a few key points.
- Indicators and Experts designed for MT4 won’t work on MT5.
- Both testers have a closed optimization method. Optimization is carried out only for those parameters that are included in MT4. If you add lines in the code, you can add custom parameters. During the optimization process, the custom parameter will be calculated but you can’t optimize the expert based on this. For example, you can add the Recovery Factor (net profit/max drawdown), but it won’t be included in the Expert properties.
- On MT5, there is only one method of modeling the price, the ticks are generated based on the historical data of M1 timeframe.
- The MT5 uses the capacity of a multi-core system, while MT4 can use only a single core. First of all, it affects the speed of the parameters testing and the optimization.
- MT5 provides testing for multiple instruments (it is an advantage for multi-currency strategies). In MT4 tester, you can perform tests only with one instrument at a time.
You set up testing and optimization almost in the same way for both testers.
Conclusion
The article gives only a general introductory overview on how the MT4 tester operates. You can learn about the methods of testing and optimization using different models and principles of modifying the result in separate intervals of the historical period on specialized forums, including mql4.com. Expert Advisor optimization is long dull work, which sometimes yields no results. It may be interesting to:
- People, who are professionally engaged in the development of expert advisors to sell them, for example.
- People, who enjoy the process of testing, optimizing and designing a code.
The best way is still manual testing, which does not require a profound knowledge of the tester work principles, but, at the same time, it allows you to evaluate the strategy performance.
I invite everyone to join the discussion on testing and optimizing forex trading strategies. Share your experience and testing methods or ask questions to advanced Alpha Masterclass traders!

